
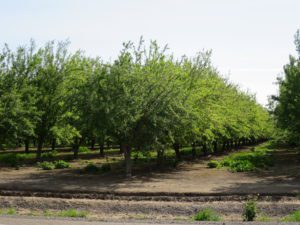
The first step in assessing the cause of canopy chlorosis and decline in an orchard is mapping the distribution of the symptoms. If a pattern of chlorosis is similar across irrigation lines, then the cause of the problem may be related to over—or under—watering. Two scenarios present themselves regularly during summer farm calls: a) terminal tree chlorosis, and b) within row tree chlorosis (Figures 1 and 2).
Figure 1. A) Chlorosis of end tree indicates excessive water on last tree in row; B) Chlorosis of overall orchard with healthy tree at end of row indicates overwatering at orchard level, and appropriate water to end tree. (Photos: B. Lampinen
Terminal Tree Chlorosis
In some orchards, the terminal tree along the irrigation line may become chlorotic and decline in advance of mortality. If terminal tree chlorosis is a trend throughout the orchard, it is worth assessing the sprinkler distribution at the end of the irrigation lines. In some orchards, the terminal tree is outfitted with a sprinkler that is not shared with a neighboring tree (Figure 2A). This terminal tree receives 1.5 x the amount of water as the other ‘healthy’ trees down the irrigation line. In an otherwise adequately-irrigated orchard, these terminal trees are over-irrigated and develop chlorosis and decline. Sometimes the terminal sprinkler is positioned adjacent to the trunk (Figure 3), resulting in direct wetting of the trunk, a condition that predisposes the tree to Phytophthora infection, particularly when surface water is utilized.)
Figure 3. The terminal tree has a microsprinkler adjacent to the trunk that is not shared with an adjacent tree. The
chlorosis and subsequent decline of the terminal tree is consistent across the orchard. Red arrows point to microsprinklers.
Correcting Terminal Tree Chlorosis
To correct the over-irrigation of the terminal tree, the micro sprinkler head can be changed to a lower flow rate. Sprinklers should be placed away from the base of trees to prevent direct contact of the trunk with the stream of water. Additionally, when replanting dead or declining trees at the end of rows, consider that the irrigation needs of the replant are considerably lower than that of the neighboring older tree in the row.
Within-row Chlorosis
If canopy chlorosis is consistent throughout the orchard, but terminal trees appear healthy, assess the distribution of sprinklers around the terminal tree in comparison to the trees along the irrigation line. If the terminal tree receives less water (Figures 1B and 2B) than adjacent chlorotic trees, consider the potential that the orchard, as a whole, is over-irrigated. To test this hypothesis, growers and orchard managers can use a pressure chamber to assess the midday stem water potential of the trees. Almond trees maintained from -6–10 bar are under low water stress, but may be more susceptible to disease. Maintenance of almonds at -10–14 bar (mild stress) from mid-June through hull split, minimizes risk of disease (i.e. hull rot) and supports shoot growth. For information on use of a pressure chamber for enhanced irrigation management of almond, walnut and prune, download UC ANR Publication #8503 (http://ucanr.edu/datastoreFiles/391-761.pdf).
Correcting Within-row Chlorosis
If the orchard at large is over-irrigated, a change in the overall irrigation strategy is warranted. A combination of pressure chamber use to measure tree water stress, and consideration of weekly

crop transpiration may enhance irrigation scheduling. The California Department of Water Resources and University of California Cooperative Extension have teamed up to provide Weekly ET (Evapotranspiration) Reports to agricultural water users to assist with irrigation scheduling. The reports include water use information for a variety of crops including almonds, pistachios,
walnuts, grapevines, citrus, and stone-fruit of mature bearing age. Adjusted on a weekly basis, water use estimates account for the changing growth stage and weather conditions at the Madera, Parlier, Lindcove, Stratford, Panoche, and Five-Points CIMIS weather stations. Each report gives crop-specific evapotranspiration (ETc, total crop water use including soil evaporation) estimates for the previous and coming week. To learn how to use these reports, please refer to the following article: http://ucanr.edu/blogs/blogcore/postdetail.cfm?postnum=26858. Crop ET reports can be found online (ie: http://cetulare.ucanr.edu/Agriculture782/Custom_Program911/).


