
What is Distribution Uniformity?
Distribution Uniformity (DU) is a measure of how uniformly water is being applied across the orchard, or whether certain parts of the orchard are receiving more water than others. It is a measure of the irrigation system.
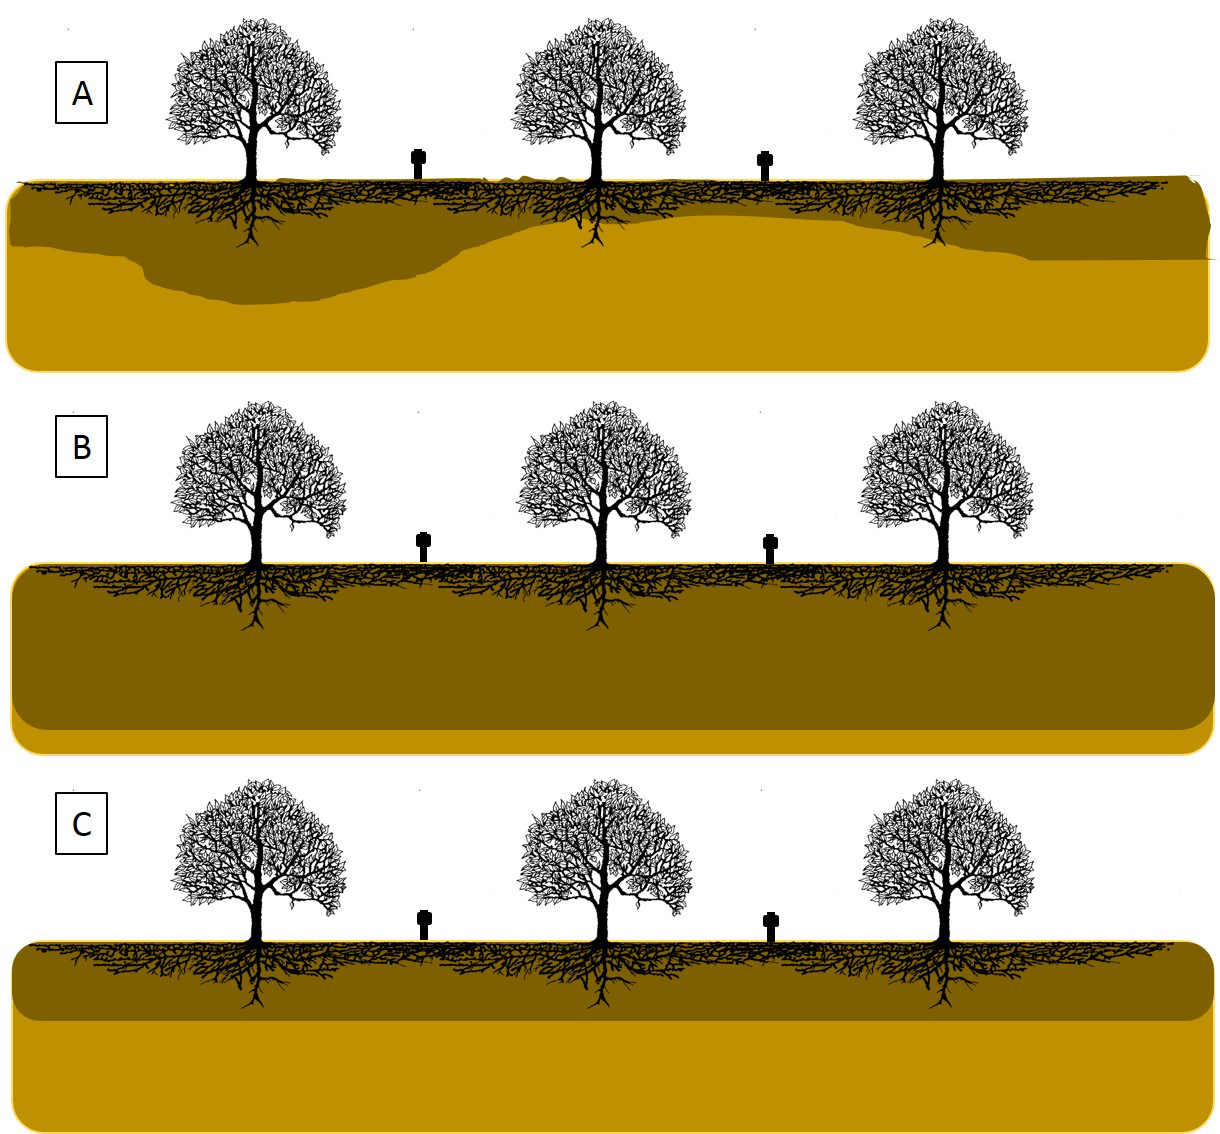
DU is a different measure than irrigation efficiency, which is a measurement of how well the applied water matches the crop water requirements. Irrigation efficiency is a measurement of how well you—the irrigator—applies a correct amount of water at an appropriate frequency. However, it is impossible to have a high irrigation efficiency without also having high distribution uniformity (Figure 1).
The best designed and maintained systems will not run at 100 percent DU, so where should you be aiming? Generally speaking, systems with a DU greater than 90 percent are in excellent shape. Systems running between 80-90 percent are average, while those below 80 percent are in poor shape and maintenance or system upgrades should be considered to improve your irrigation efficiency. Expected DUs for different irrigation system types are shown in Table 1.
Table 1. Expected DU from different types of well-designed and well-maintained irrigation systems.
| Irrigation System Type | Expected DU Performance(assuming good maintenance) |
|---|---|
| Flood / Furrow | Up to 80% |
| Solid Set | 90% |
| Drip | 95% |
| Micro-sprinkler | 90-95% |
Just because you have a drip or micro-sprinkler orchard doesn’t mean that your system is running at a 90 percent or greater DU. Irrigation system evaluations in the Sacramento Valley from 2002-2018 indicated that 39 percent of drip systems and 30 percent of micro-sprinkler systems were running at a DU of 80 percent or less.
Impact of Poor DU will be Reflected in Orchard Health and System Run Times
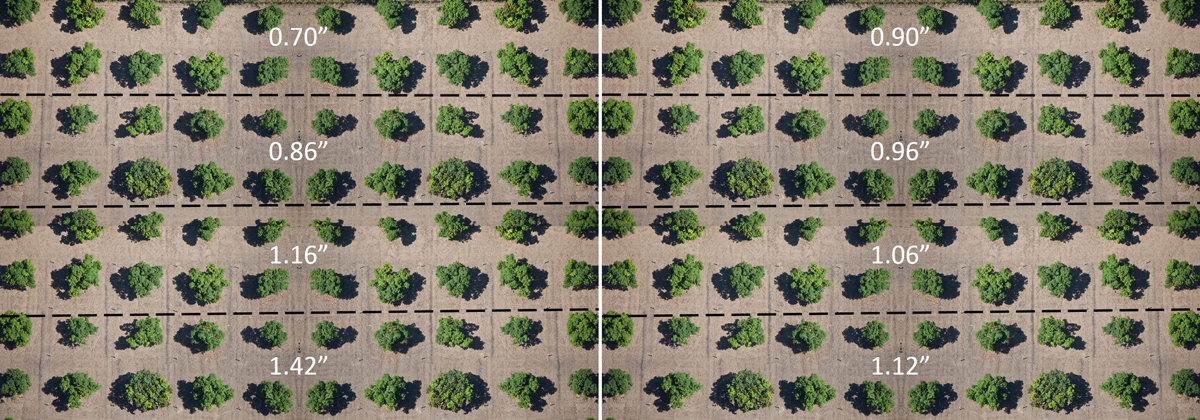
Figure 2 shows a difference in applied water to an orchard where the DU is 90 percent versus a DU of 70 percent. In a scenario where the irrigator is targeting 1 inch of applied water in a block with a 90 percent DU, the applied water in the driest quarter of the orchard was 0.9 inches, while the wettest quarter of the orchard received 1.12 inches—a difference of 0.22 inches between the driest and wettest quarters of the orchard.
However, an irrigator targeting 1 inch of applied water in a block with a 70 percent DU will see the driest quarter of his orchard receive 0.7 inches, whereas the wettest quarter of the block receives 1.42 inches of water. In this scenario, the wettest quarter of the block is receiving TWICE as much water as the driest. Management in a block where trees are receiving wildly different amounts of water becomes complicated because key events such as hull split and harvest can vary in duration and timing depending on tree water status. Equally, if not more important, fertigation of nutrients such as nitrogen will not be uniform and increase the risk of leaching in the wettest areas of the block.
A low DU will also impact your bottom line because you will need to run your irrigation system longer to ensure that the driest quarter of your block receives the target application amount. Table 2 shows an example of the weekly evapotranspiration (ET) use of almonds, pistachio and walnuts in August. The columns under the heading ‘Adjusted for System Efficiency’ show how much water would need to be applied for a system running at 70 percent efficiency to meet the weekly water requirements. Using almonds as an example, an irrigation system running at 90 percent DU would need to apply 1.8 inches of water to ensure the trees in the driest portions of the orchard receive the minimum water requirements. However, a system at 70 percent DU would require 2.3 inches of water. Over the course of the season, system inefficiencies add up. Table 3 illustrates the additional run time a system may incur to ensure the driest trees receive the minimum water requirement.
Table 2. Sample from an ET irrigation report from August 2018. The columns under ‘Adjusted for System Efficiency’ show how much more water needs to be applied to ensure that the trees in the driest quarter of the block receive the amount of water shown under the ‘Past Week Water Use’ column.
| Crop | Past Week Water Use | Adjusted for System Efficiency | ||
|---|---|---|---|---|
| 70% | 80% | 90% | ||
| Almonds | 1.6 | 2.3 | 2 | 1.8 |
| Pistachios | 1.7 | 2.4 | 2.1 | 1.8 |
| Walnuts | 1.4 | 1.9 | 1.7 | 1.5 |
| Crop | Past Week Water Use | Adjusted for System Efficiency | ||
| 70% | 80% | 90% | ||
| Almonds | 1.6 | 2.3 | 2.0 | 1.8 |
| Pistachios | 1.7 | 2.4 | 2.1 | 1.8 |
| Walnuts | 1.4 | 1.9 | 1.7 | 1.5 |
Table 3. Hypothetical difference in run time required to irrigate 40 inches of water over the course of a growing season in systems with different DU efficiencies. The second column shows the amount of water required to ensure the driest quarter of the orchard receives a full 40 inches of water. The last column shows the additional hour of run time associated with the higher applied water requirement.
| DU | Adjusted Water Req’d to apply 40″/season | Difference from 95% DU | Application rate (in/hr) | Season long run time hrs | Difference in run time from 95% DU (hrs) |
|---|---|---|---|---|---|
| 95% | 42.0″ | – | 0.1 | 420 | – |
| 90% | 44.4″ | 4.4″ | 0.1 | 444 | 24 |
| 80% | 50.0″ | 10.0″ | 0.1 | 500 | 80 |
| 70% | 57.1″ | 17.1″ | 0.1 | 571 | 151 |
Causes of Poor DU
The maximum DU of your system is tied to the quality of the original irrigation system design. A quality design should have accounted for friction loss throughout the main and lateral lines by choosing an appropriate diameter for the line length. Appropriate pressure regulators, filters and emitters also contribute. It is difficult to correct for poor system design after installation without considerable expense. If you are currently in the irrigation system design phase of orchard development, take care to avoid shortcuts or cost-cutting approaches that come at the expense of uniform water application.
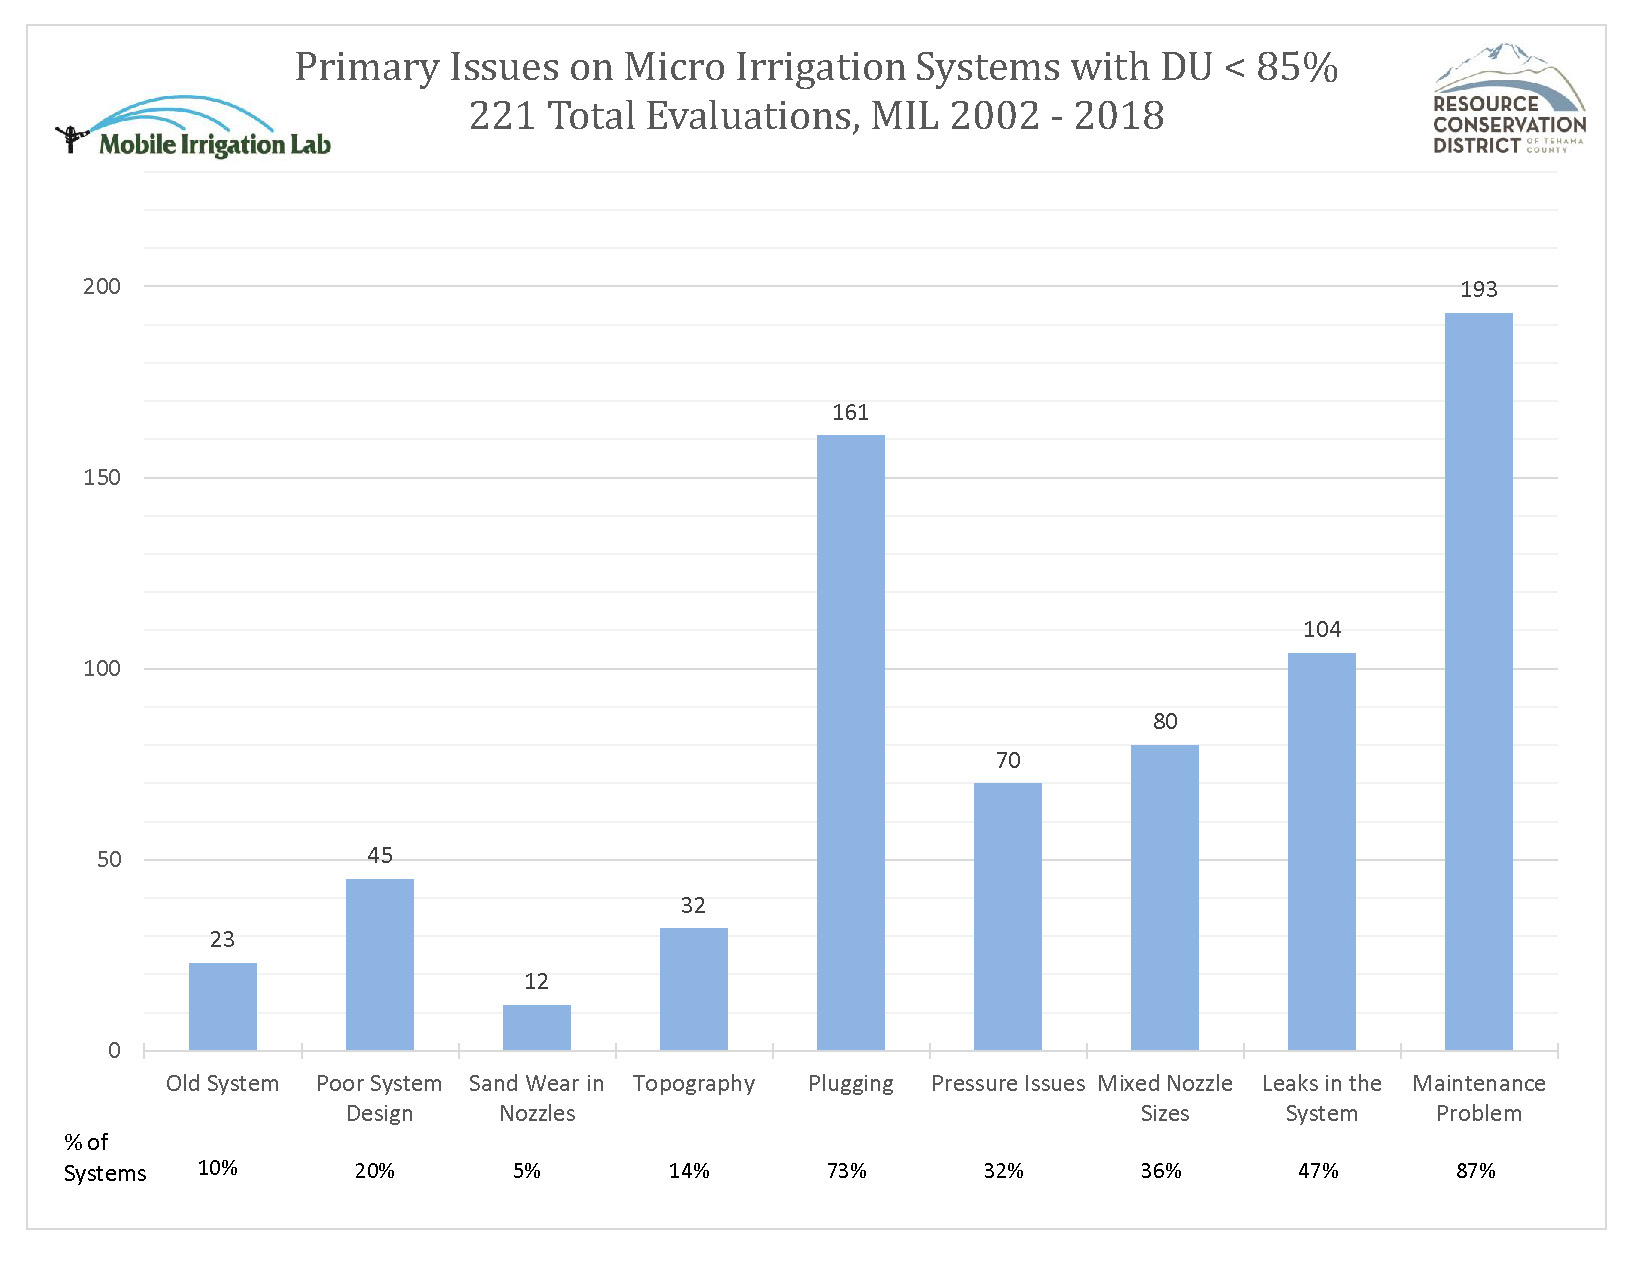
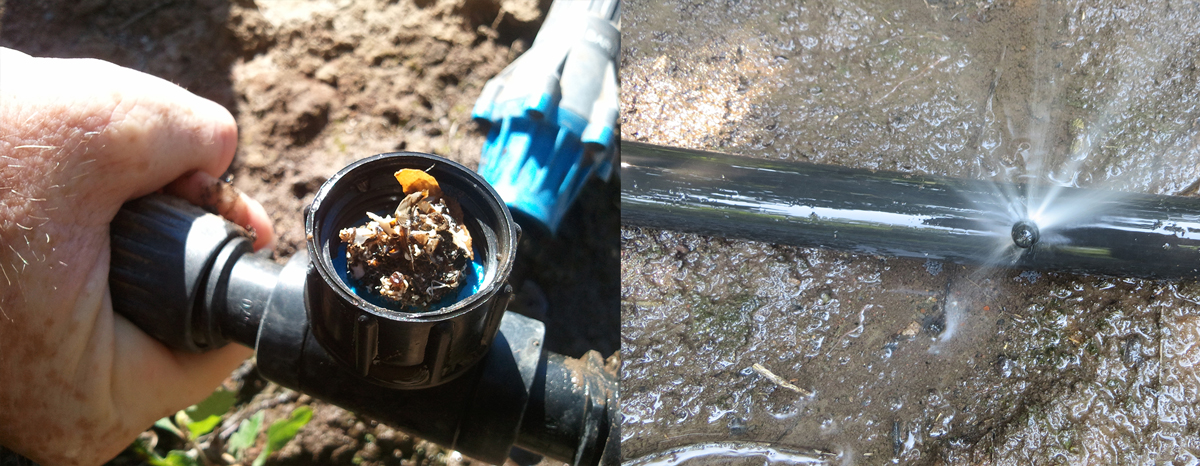
However, while important, system design accounts for a minority of the causes contributing to poor DU. In the Sacramento Valley, 20 percent of the systems with less than 85 percent DU could be attributed to poor system design (Figure 3). Poor system maintenance, including wear, leaks, mixed emitter sizes, and plugged emitters were responsible for the poor DU of the majority of the systems (Figures 3-4).
All orchards with pressurized irrigation systems should have a maintenance routine to catch problems related to routine wear and tear on the system. Routine activities include checking pressure regulators, flushing the lines regularly, and inspecting nozzles and emitters for plugs or leaks at each irrigation. You should also be prepared to make the investment on a chemical injection system to manage mineral or biological plugging of your emitters. See the resources at the end of this article for further information on system maintenance.
Measuring Your DU
You can measure your own DU or rely upon a professional consultant to perform an evaluation for you. Depending on your location in the state, a local Mobile Irrigation Lab may be able to come perform an evaluation for reduced or no charge (see resources below). A full irrigation system evaluation will calculate your DU, and should also help identify factors contributing to poor DU within your system.
It is also possible to get a rough measure of your DU with your own staff. The process involves testing locations along the main and lateral lines throughout the system. Use a graduated cylinder and a stopwatch to measure the application rate of multiple different drip emitters or sprinklers, both near the water source and at the ends of the lines. You could also utilize a pressure gauge with a pitot tube to measure uniformity of the pressures across the field and ensure that pressures are within the recommended operating requirements of the emitters. See the Resources at the end of the article for more detailed information on calculating your DU.
Irrigation system maintenance should be a priority within your operation, and should be considered an on-going task rather than a one-time event. Poor uniformity increases your costs and decreases tree vigor and possibly orchard longevity. Make use of your local crop advisor and the resources below, and ensure that your system is up to par.
Resources
Irrigation system maintenance:
micromaintain.ucanr.edu
sacvalleyorchards.com/almonds/irrigation/irrigation-system-maintenance
Measuring your system DU:
ccfruitandnuts.ucanr.edu/files/239177.pdf
Publicly run Mobile Irrigation Labs (MIL) in California:
Kern County: http://www.rrbwsd.com/water-use-efficiency
Napa County: http://naparcd.org/assessment-programs/irrigation-evaluation/
San Luis Obispo: http://www.us-ltrcd.org/services/water-resources-managment/mobile-water-lab/
Tehama County: http://www.tehamacountyrcd.org/services/lab2.html
Ventura County: http://www.vcrcd.org/water
Note: Depending on funding, some of these MILs also serve adjacent counties


