A few warm spells and a record-breaking dry February with little-to-no fog have a lot of people in the tree crop industry wondering about chill accumulation this past winter, and it would impact bloom in the spring. As I write this article in late February, almonds and a few early stone fruit are the only trees to have bloomed. But, despite some warm conditions, the chill accumulation numbers indicate that we should have enough chill for a decent bloom in our later blooming crops. You can be the judge, reading this in April, as to whether those accumulation numbers match what the trees felt and needed when it comes to winter chill accumulation. The story of this winter varies depending on how you count winter chill, so in addition to reviewing how chill accumulation went this past winter, now is a good opportunity to discuss tools to help you count chill in the future.
Why Do We Care About Winter Chill?
Deciduous trees have evolved a mechanism to essentially count the passing of winter, to know when cold conditions are in the rearview mirror, warm conditions are stable, and the outside world will be a safe place for tender flower blossoms and young leaves and shoots. Crops and cultivars vary in how much winter cold they need to meet this cold accumulation threshold. Some spring warmth can compensate for trees not getting all the chill they want, but there is a minimum chill requirement that needs to be met for buds to open in the spring. As the warm winters of 2013-14 and 2014-15 reminded us, when deciduous trees don’t experience adequate winter chill, they will have straggled, prolonged bloom, which can lead to problems protecting flowers from spring diseases and a variety of sizes and harvest readiness timings at the end of the season. Even worse, inadequate chill can result in delayed bloom, which can mean pollinizers don’t overlap with the target variety, leading to poor fruit or nut set.
So, How’d Chill Accumulation Stack up This Year?
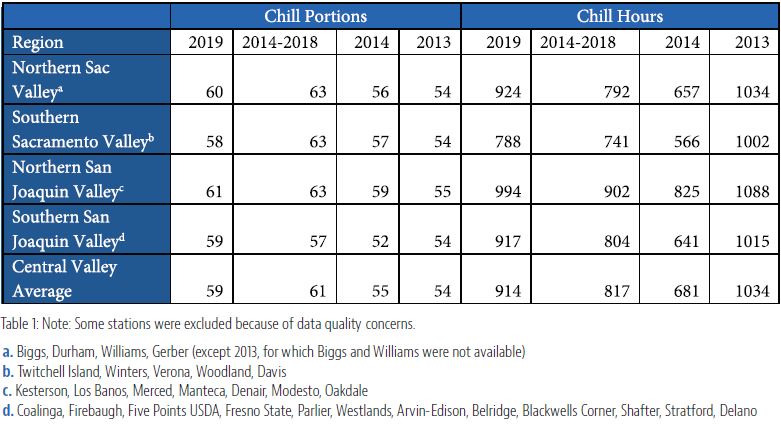
When I ran the numbers on February 19th for chill accumulation at all the CIMIS stations in the Central Valley (Nov 1-Feb 19), the average for the whole valley is 2 percent below the average of the last five years when counted in Chill Portions. As you can see in Table 1(see below), regional averages ranged from 8 percent below average in the southern Sacramento Valley (5 chill portions) to 2 percent above average in the southern San Joaquin Valley (2 chill portions). Note that the year listed is the year in which the winter started. For example, this winter is shown below as 2019. Chill hours, on the other hand, indicates we are 11 percent above the average of the last five years for the whole Central Valley.
How Does This Year Compare?
Another way to look at this winter is to compare it with the winters of 2013 and 2014, the last couple of low chill winters that resulted in unusual (in some cases, yield-decreasing) spring bloom timing. Compared with the winter of 2014, across the whole Central Valley, chill is 7 percent higher this winter when counted using chill portions. This ranges from just 2 percent higher (1 chill portion) in the southern Sacramento Valley to 13 percent higher (7 chill portions) in the southern San Joaquin Valley. Winter chill accumulation this year is fairly equal across regions. The relative difference is due to 2014 being a much warmer winter for the southern San Joaquin. Compared to the winter of 2013, we’ve accumulated 8 to 11 percent more chill (5 to 7 chill portions) this year. On the other hand, Central Valley-wide, this winter was 34 percent higher when counting using chill hours.
Looking both relative to average recent conditions and relative to warm recent years, while it was not a boom winter for chill accumulation, it does not look like a bust winter either. When counted using the chill portions method, this winter’s chill accumulation has squeaked through above the yield-decreasing winters of 2013 and 2014. I would not expect the flash bloom we saw in almond this year to play out in other crops. But the chill portions numbers indicate we have (narrowly?) avoided yield-decreasing bloom and leaf-out problems this season.
I’ve largely emphasized chill portions above. This is a winter to highlight the differences among the two models, because depending on which tool you use to count chill, this winter was either warm but not disastrously warm (chill portions) or cooler than average (chill hours). We’ll see if bloom and leaf-out timing this spring gives hints to which is true. Research in orchard crops indicates that the chill hours model is not the best option. Research over the last 30 years in every Mediterranean climate (California, Europe, Israel, Australia, South Africa and South America), has found the chill portions model to count winter chill accumulation as well or better than the chill hours model, in terms of the stability of the output and whether accumulation numbers match up with what trees show on the ground and in the field.
Chill Hours Model v. Chill Portions Model
There are three basic differences between the chill hours model and the chill portions model.
- Chill hours count any hour between 32° to 45° F as the same. Chill portions give different chill values to different temperatures. Temperatures between 43° to 47° F have the most chill value. The chill value on either side of that range are lower, dropping to no value at 32° F and 54° F.
- Chill hours only count up to 45° F. Chill portions count up to 54° F. This makes chill portions better able to approximate how trees in Central Valley agriculture, most of which evolved in fairly mild climates, count chill.
- Chill hours do not subtract for warm hours. Chill portions can. The math is tricky, but the concept is simple: Chill portion accumulation is a two-step process. First, a ‘chill intermediate’ is accumulated, but can be subtracted from if cold hours are followed by warm hours. Second, once the chill intermediate accumulates to the certain threshold, it is converted into a ‘chill portion’ and the chill intermediate count starts over from zero. The chill portion cannot be undone by later warm temperatures.
It’s hokey, but simpler to think of chill portion accumulation as filling ‘chill buckets’ which then fill a ‘chill tank.’ Cool hours add to what’s in the bucket until it’s full. Warm hours along the way can spill out some of what’s in the bucket. But once the bucket is full and dumped into the tank, that chill can’t be spilled or lost. The warm January of 2014 (winter 2013 in the table above) showed the need for this component. Warm January day temperatures subtracted from the cool temperatures of the night before in the chill portions counting (though did not subtract from cool temperatures in November and December). However, chill hours kept ticking upward. This led to a surprising spring in 2014 for those who were watching the high chill hours accumulation. Bloom was much longer than normal for many cherry and prune orchards, reportedly up to three weeks, as opposed to the usual 3 to 6 days. Pollinizer varieties in pistachio did not bloom in time with the main variety in many orchards. These abnormal spring conditions resulted in significant yield reductions for many growers.
How Can You Check on Chill Accumulation in Your Area?
Whether you want to start getting more comfortable with counting in chill portions, or want to check up on chill accumulation using the chill hours model, UC has tools to help you. Click on over to http://fruitsandnuts.ucdavis.edu/Weather_Services/chilling_accumulation_models/. The UC Fruit & Nut Research and Information Center has teamed up with the CIMIS weather station network to automatically calculate winter chill accumulation using multiple chill models, including chill portions and chill hours. Select a model first, then your nearest CIMIS station from the list, then set your dates (I start counting Nov. 1 for all models). The great thing about this tool is it will give you a graph of accumulation over the season for the last five years (as well as a numerical table of chill accumulation every day of the winter period). This allows you to look back and visually see, for example, how much a warm spell impacted chill accumulation this winter. The graph will also show chill accumulation for the last five years, so you can see how the current year compares with winters past.

When using these tools to look at the Firebaugh station, for example, you can see the trends discussed above playing out at one station. Chill portions accumulation this year (2019, dark blue) matches with many recent years, and is not as low as 2014 (light blue) (Figure 1, see above). The chill hours graphic shows this winter to have been above all other years except 2015 (purple) in chill accumulation (Figure 2, see below). Time and the trees may tell which version of counting is more accurate.


