Thus far, deciding when to deficit irrigate, spray pesticides and harvest pistachios has been based on the current season’s weather, historical calendar dates and direct observation of when the growing pistachio nut begins and ends with the three seasonal growth stages: Stage I – shell enlargement; Stage II – shell hardening and thickening; and Stage III – kernel growth and split. Based on the work of Goldhamer and Beede in the 1980s, 25% to 50% deficit irrigation should not begin until the nutshell has fully grown in Stage I, should continue through Stage II, and should stop when the kernel begins growing in Stage III. This irrigation strategy, regulated deficit irrigation (RDI), ensures optimal nut size, which is determined by shell growth, and optimal nut fill and split, which are functions of kernel growth. Timing of pesticides for small plant bugs has also been based on nut growth stage, specifically late in Stage II when the shell is too hard for small bug mouthparts to pierce. Time of harvest late in Stage III, when the kernel is fully grown and the shell split, is the most difficult to time as the percentage split, hull breakdown or navel orangeworm (NOW) infestation can significantly affect price per pound.
Creating a New Model
The combined use of current-season weather, historical calendar dates and direct observation have been sufficiently reliable until two things changed: cultivar and weather. As long as the industry was the female ‘Kerman’ and male ‘Peters’, and growers knew the historical dates and could monitor current weather patterns and nut development, these techniques worked. However, now, with Parfitt and Kallsen’s earlier-maturing ‘Golden Hills’, Lost Hills’ and their male pollinizers as well as California’s changing climate, these methods of timing irrigation, pesticides and harvest are less reliable.
The map and temperature accumulation graph in Figure 1 show why. For three years, temperatures were monitored in eight Central Valley locations over 300 miles north to south; the locations are shown on the map. In the accompanying graph is the temperature as heat unit accumulation above 45 degrees F (7.5 degrees C) starting on day 100 of the year (roughly April 10.) Note that by day 210 (roughly mid-July), there is an approximate 30-day difference in when 1500 growing degree days (GDD) above 45 degrees C has been accumulated. Differences in heat accumulation of this magnitude can have a significant effect on pistachio nut growth.
All plant growth, including final tree or nut size, is a function of genetically determined accumulated heat units, GDD. This is true of the three stages of pistachio nut growth. The shell growth in Stage I, the shell thickening and hardening in Stage II and the kernel growth in Stage III that causes shell split all have specific, genetically determined heat unit accumulations. If the specific GDD accumulations required to complete these three growth stages are known, we could use historical temperature records and current weather monitoring to predict when these three growth stages will occur and more accurately implement the production practices based on these growth stages. In other words, instead of using the calendar for RDI, pesticide applications and harvest timing, we can predict the time to start these operations based on GDD accumulation. This is a common practice for insect pests in multiple crops.

There are few models of tree fruit and nut development that have been converted into grower-friendly computer-aided systems. For an effective, web-based decision support tool, the model is used as the fundamental decision-making tool, and the real-time temperatures are required for management. This is the first time it is being tried for California pistachios.
Before discussing how to use the model, a general summary of how the information supporting the model was generated is given. Table 1 shows the experimental collection and monitoring sites, Figure 2 demonstrates how the weekly three days of laboratory measurements were done, and Table 2 gives the average values obtained for the ‘Kerman’ female cultivar.


This combination of intensive nut measuring and sampling generated growth curves for all six cultivars like the ones provided for ‘Kerman’, Figure 3. The horizontal axis gives the accumulated GDD above 45 degrees F (7.5 degrees C) past 50% full bloom required to complete Stage I, Stage II and Stage III. The vertical axis gives the percentage of growth stage completed, not the shell or kernel volume in mm3 or shell hardness in mg/mm2. This graph demonstrates that regulated deficit irrigation should begin at about 500 GDD and be halted at about 800 GDD. Note that shell hardening continues past the beginning of Stage III and is not the discrete stage it was previously thought to be. Therefore, at this time, the graph cannot be used to predict when the nuts are no longer susceptible to small bug damage as the shell hardness in mg/mm2 must be determined. When the kernel volume approaches 90%, monitoring for shell split to predict harvest timing should be started. Generally, as all three curves approach 90%, monitoring the nuts visually should begin.
Using the Prediction Site
In practice, using accumulated GDD to predict nut growth stages is done through an interactive website
(ucanr.edu/pistachio-nut-growth) which requires the following inputs: location, cultivar, a bloom date range, desired percentage of the maximum values and preferred weather data source. The website will then generate predicted calendar dates for a specific growth stage, using weather data from the selected location.
The website uses a simple interface designed to work well on phones and includes instructions. The four sections are as follows:
Select location.

The first step is to select your location by clicking on the map or typing longitude-latitude coordinates. The current version supports all of California, Nevada and portions of neighboring states.
Pistachio options.

In this section, select your cultivar, date range for your analysis and the percentage of the maximum theoretical values to highlight in the results. The default maximum value is 90%, meaning the results will tell you when nut volume, shell hardness and embryo length are predicted to reach 90% of their theoretical modeled maximum value.
Weather data.

Click the wheel icon to open the weather data options. Here, you can select a weather data provider for the historic period, the present season and the 10-day forecast. Additional weather data sources may be added in the future. The historic averages will be used in two places in the report: 1) as a comparison for the present season, and 2) as a substitute for daily temperatures beyond the 10-day forecast.
Report.
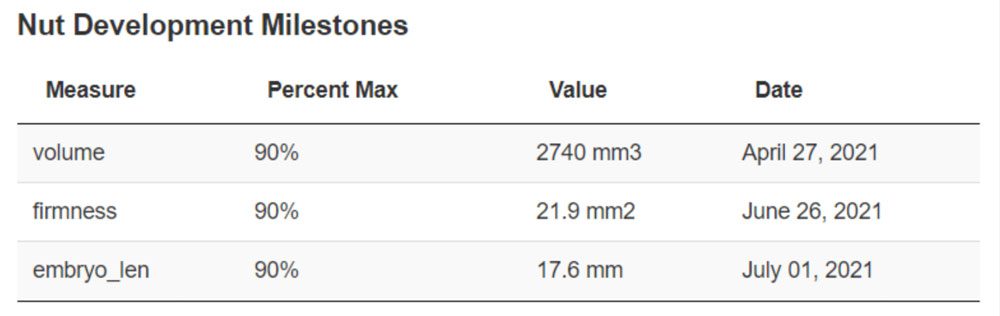
Click the ‘Run’ button to generate the report. Once the report is finished, scroll down to see it. The report includes several graphs that show modeled nut growth and a table of dates for the key milestones. The graphs are all interactive, so if you hover over them with the mouse, you can zoom in and out, show the values, download it as a PNG file, etc.


In conclusion, models are decision support tools, not calculators of definite outcomes like an irrigation calculator. This website’s output must be accompanied by ground truthing observations when the values approach 90% for each stage. This model was developed by a large group of researchers at all levels, including professors, postdocs, visiting scientists, graduate and undergraduate students, student assistants and computer scientists that sampled, measured and analyzed data from six different cultivars over eight Central Valley locations on 700-mile trips weekly during the season for three years. However, it is only a predictive model to support decision making.
The work was generously supported by California Pistachio Research Board. The work would not have been possible without the cooperation of the growers and managers for each experimental site. We thank Alan Scroggs, Bill Seaman, Charlie Rose, Chris Couture, Dave Peterson, Gary Robinson, Gary Weinberger, Ali and Hamid Orandi, Jeff Gibbons, Jeff Schmeidrer, Jonathan Battig, Mitchell Coit, Setton Farms and Vahid Salehi. We also thank Craig Kallsen and Dr. Themis Michailides for providing plant materials from experimental orchards.
This work is dedicated to the memory of Mr. Ali Orandi, a pioneer in California’s pistachio industry and dear friend with whom we spent many hours learning in his orchards and enjoying lunches in “Ali’s Kitchen”.