There has been a considerable increase in remote sensing techniques (RS) over the last decade. Remote sensing can provide farmers with information on crop health, soil conditions and climate, and opportunities to make better management decisions. The accessibility of uncrewed aerial systems (UAS) provides several potential benefits of using RS techniques for specialty crop production. One recent advantage is that growers can use affordable drones equipped with imaging sensors to monitor key plant attributes such as plant height, volume, photosynthesis potential, temperature, chlorophyll, nitrogen and diseases throughout the field. However, there are still uncertainties about the best way to use this technology for specialty crop production. The primary focus of this article is on remote sensing in specialty crops: How does it work? Why should growers be interested? What are the applications of RS in specialty crops? And what drawbacks or limitations should growers consider before adopting RS technology?
This article will also provide basic information on spectral analysis and discusses the output uncertainty of some common aerial image interpretation processes and how to recognize and avoid misleading outputs that would otherwise lead to risky decision-making.
How Does It Work?
Remote sensing (RS) includes information acquired from electromagnetic energy that is reflected or emitted by the earth to provide spatial and time-integrated information. It involves collecting information from sensors deployed on satellites, aircraft, drones or on the ground and the analytics of this data to convert them to insightful knowledge that can be integrated into the farm management decision-making process.
The interaction of sunlight with vegetation (how light is absorbed or scattered) varies based on how they function in the environment. The fundamental properties of leaf spectra were defined a few decades ago. Leaves’ light absorption and scattering behavior can be affected by crop type, water content, leaf pigments, nitrogen, chlorophyll, disease, stress and age. Multispectral cameras mounted on fixed wings or rotary drones are the most common means of UAS-based remote sensing available to growers. Multispectral cameras are similar to RGB cameras but usually have more than three channels covering visible and near-infrared (400 to 1000 nm) regions.
Two non-visible spectral bands commonly used for multispectral sensors are red edge (within 670 to 760 nm) and near-infrared (NIR, 800 to 900 nm). Imagery from multispectral cameras is usually used to generate vegetation indices (VI), such as normalized difference vegetation index (NDVI=(NIR-Red)/(NIR+Red)) and Normalized Difference Red Edge (NDRE=(NIR-RedEdge)/(NIR+RedEdge)) that combines two or more bands to generate a single index to indicate plant status. However, various plant health and vigor parameters often influence the index value, making it difficult to draw an inevitable conclusion. Also, the calibration process for one particular camera cannot be transferred to another because of various instrumental characteristics. Therefore, spectral models based on VIs are often not generalizable and highly influenced by the specific dataset used for model calibration. Also, VI-based RS models are purely empirical that ignore the mechanism of light interactions with vegetation.
Alternatively, physical-based models use radiative transfer theory to predict plant traits mechanistically based on the amount of light energy absorbed by the plant and its photosynthetic performance. These models were developed mainly through monochromatic light absorption and reflectance measurements, which are difficult to capture by multispectral cameras individually. Mechanistic models still face many difficulties regarding the simulated physical processes and their accuracy in predicting plant health. Still, they offer a robust interpretation that minimizes the uncertainty compared to the pure empirical data-driven approaches.
Why Should Growers Be Interested?
Transition to regenerative and sustainable crop production requires the adoption of precision agriculture (PA) practices, which requires accurate, timely and precise information about plant health, productivity and stress statuses. Farmers can supplement their existing data collection systems with RS methods to conduct frequent and large-scale crop monitoring, obtain helpful insight into their field variability, and determine strategies to manage the less productive or stressed zones differently so that they can recover and the entire field can produce more uniformly.
Remote sensing can provide farmers with objective, timely and precise information to manage crops more efficiently and optimize soil health management practices. One of the potential benefits of RS is that growers can monitor disease-stricken areas of crops and assist in deciding when to spray fungicides or nutrient sprays based on plant photosynthetic status and vigor indicators. Also, growers can gain insight into nitrogen content variability throughout the field through RS-based monitoring systems that will help them to avoid crop loss or soil contamination due to under- or over-fertilization.
Applications in Specialty Crops
The most frequent uses of remote sensing in specialty crops are classified into seven groups: water status monitoring, disease detection and control, yield mapping and prediction, nutrient management, phenotyping (breeding), soil and salinity monitoring, and other managerial practices.
Plants under water stress usually show higher temperatures compared to well-watered plants. Thermal sensing is a traditional method to monitor crop water stress, determine evapotranspiration (ET) and identify a leak or clog in the irrigation system.
Plant disease or any factor that prevents plants from reaching their maximum productivity can show signals that are detectable by spectral cameras. For example, diseases that affect the photosynthesis rate and decrease detectable green biomass will reduce the reflectance in the Red-Edge/infrared region that can be identified with multispectral cameras.
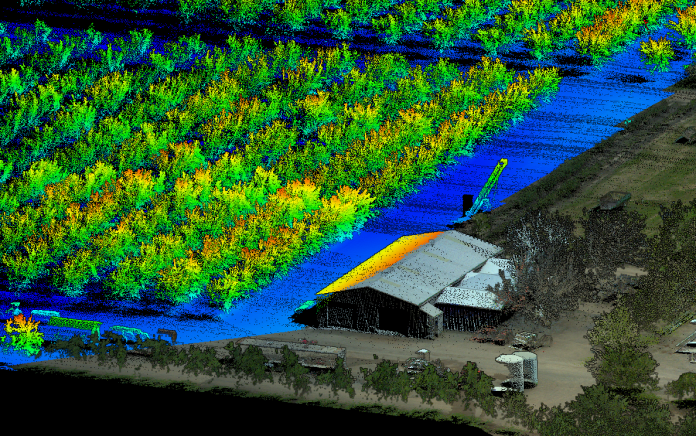
Yield can be forecasted by using RGB imagery to monitor flowers during the bloom time or by analyzing the plant canopy in a 3D environment to determine canopy light interception and maximum photosynthesis capacity. Low-altitude UAS-based RGB imagery was also used to identify and count fruits and generate a yield variability map.
Retrieval of plant nitrogen content by RS has been one of the main focuses of researchers in past decades due to the importance of precise nitrogen management for avoiding crop loss and environmental contamination. Monitoring crop N content is essential at the early vegetative stages to ensure growers can make a timely decision on the best nitrogen management practice that satisfies the nutrition need of all plants. Most leaf nitrogen is stored in protein detectable in the shortwave infrared (SWIR) region of the electromagnetic spectrum (above 2000 nm). However, commercial multispectral cameras do not cover SWIR, so the nitrogen retrieval models are essentially based on sensing chlorophyll or other light-harvesting components.
Excessive salt concentration in the soil can reduce osmotic potential and water uptake by increasing the cost of energy required for water extraction, transpiration and photosynthetic rate, eventually leading to underproduction. Both thermal and multispectral imaging can be used to monitor the indication of salinity indirectly.
Challenges and Limitations
Although the tools and equipment for aerial imaging are more accessible and affordable to growers, it is still challenging to interpret the spectral variability at the canopy level due to the additional impact of the canopy structure on the reflectance measured by cameras. Achieving an excellent spectral representation of the canopy at the canopy level with minimized errors is a challenge facing current RS research.
We must incorporate improved technologies and methods for data collection, analysis, processing, transmission, communication and storage to increase remote sensing capabilities for specialty crop production. Interpreting the enormous amount of RS data available using off-the-shelf software requires robust computing and data transfer infrastructure. Also, a standard radiometric calibration and image processing pipeline should be developed to ensure the quality of the interpreted knowledge extracted from raw data. Finally, we still need to establish the best practices for variable management strategies in specialty crops to increase farmers’ adoption of decision-support tools based on RS technology.


